
Jump to:
A Closer Look at Strategic vs. Tactical Investing
Factors Affecting Strategic Asset Allocation
Strategic Asset Allocation: A Contrarian Approach
Temporary Downturns Will Likely Continue to Wreak Havoc
Examples of Unexpected Market Moves
The Importance of a Long-Term Perspective
In an era defined by rapid headlines and ever-shifting policy, the ability to think strategically—across your life, your business, and your investments—has never been more vital. Just as visionary companies invest not for tomorrow’s quarterly report but for the next decade of growth, so too can investors harness a disciplined, long-term mindset to build and preserve wealth.
Learning from Industry Pioneers
Before we explore how several industry trailblazers have strategically reshaped entire markets, consider a truth that transcends any quarterly earnings report: enduring success is not forged in the heat of today’s headlines but in the calm rigor of a decades-long plan.
Too often, investors find themselves lured by the latest flashpoint—whether a viral tweet or a surprise tariff announcement—only to discover that yesterday’s news seldom fuels tomorrow’s returns. The companies that redefine their industries do so by mapping out a vision far beyond the next earnings call, investing patiently in ideas that may take years to bear fruit. In much the same way, your portfolio thrives when built on a clear allocation framework, disciplined rebalancing, and the conviction to think and execute strategically.
Here are five examples of innovative companies that think long-term and act strategically to maintain their edge:
- Amazon: Rather than relying on short-term sales tactics, Amazon strategically invests in cutting-edge technology like Amazon Web Services, Alexa, and Prime delivery to enhance the customer experience. This long-term focus on innovation and meeting customer needs has allowed them to expand beyond retail, creating a diverse ecosystem of products and services.
- Apple: Instead of prioritizing quick product releases and low prices, Apple strategically concentrates on developing high-quality, innovative products like the iPhone, MacBook, and Apple Watch. By focusing on quality and design, Apple has built a loyal following that values their sleek, user-friendly devices and premium brand image.
- Starbucks: Rather than employing aggressive advertising and discount pricing, Starbucks strategically creates a unique customer experience through inviting store environments, customizable beverages, and personalized service. This emphasis on personalization and atmosphere has fostered a sense of community, ensuring customers keep coming back for their daily caffeine fix.
- Tesla: Instead of conforming to the traditional automotive industry’s focus on gasoline-powered vehicles, Tesla strategically invests in electric vehicle technology and renewable energy solutions. This innovative approach has led to popular models like the Model S, Model 3, and Model X, appealing to customers seeking cutting-edge, eco-friendly transportation options. And an edgy, cool, electric and bullet proof pickup truck? Heck yeah!
- Nike: Rather than relying solely on product sales, Nike strategically builds brand value through innovative athletic apparel and footwear like Flyknit shoes and Dri-FIT clothing. Complemented by their emphasis on branding and social responsibility, Nike creates an inspirational, inclusive image that resonates with customers.
These examples show the benefits of a strategic approach over short-term actions. By focusing on long-term goals, innovation, and customer satisfaction, these businesses have achieved lasting success. We believe adopting a strategic approach can be replicated when applied to personal investing, especially for your long-term financial goals.
A Closer Look at Strategic vs. Tactical Investing
For years, my investment teams at my prior firms, as well as Aurelius Family Office have been aligned with a global macro market approach to investing. The strategic asset allocation (SAA) approach AFO utilizes helps manage a balanced, diversified portfolio for clients and aligns with your objectives, risk tolerance, and time horizon. Generally, we believe it is a solid investment approach for our clients who value long-term investment approaches, with a view beyond the business and consumer headlines of today’s news.
Our process involves working with clients to set their risk and investment policy based on their goals and cash flow needs. For example, if an agreement is made with a retired client to allocate 60% of their assets in stock and 40% in bonds, we then manage that portfolio according to a determined percentage across global market segments and generally adhere to that investment policy.
We embrace a macro perspective rather than a micro one. This includes utilizing data from DFA’s strategic asset allocation methodology, a long-term portfolio approach focused on the selection of asset class allocations and periodic rebalancing based upon client parameters, including tax and asset location driven issues. Rebalancing happens when the asset allocation weights significantly differ from the strategic asset allocation weights due to unrealized gains or losses in each asset class.
An SAA strategy aims to diversify a portfolio and achieve the highest rate of return for a given level of risk; this strategy involves selecting and maintaining target asset weights over an extended period.
Factors Affecting Strategic Asset Allocation
There are several factors influencing strategic asset allocation weights:
1. Risk tolerance
Investors with a high-risk tolerance can tolerate greater volatility. Consequently, they are likely to allocate a higher weight to stocks and a lower weight to bonds and cash. Conversely, investors with low risk tolerance would assign a lower weight to stocks and a higher weight to bonds and cash.
2. Investment horizon
Investors with a longer investment horizon are inclined to invest in riskier asset classes. This is because a longer investment horizon allows them to endure poor market conditions without needing to liquidate their assets to meet retirement or cash requirements.
For instance, a 20-year-old student would typically adopt a strategic asset allocation strategy primarily consisting of stocks. In contrast, a senior who is retiring in two years and requires funds for retirement would likely follow a strategic asset allocation consisting of some equity for inflation protection and growth, and more bonds and cash for stability and cash flow generation.
3. Return objectives
The desired returns by an investor significantly influence strategic asset allocation weights. For example, consider the annual return profile for hypothetical investors Jane and Ted, both age 62, for stocks, bonds, and cash:
If Jane and Ted wished to achieve an annual expected return of 6.1%, they would need to adopt the following weights: 75% stocks, 25% bonds, and 0% cash.
Therefore, the return objectives of Jane and Ted have a substantial impact on the strategic asset allocation weight. A higher return objective necessitates a higher asset allocation to specific asset classes to attain that desired return.
Strategic Asset Allocation: A Contrarian Approach
It is noteworthy that strategic asset allocation follows a contrarian approach to investing. When an asset class outperforms another, the SAA strategy involves selling positions in the outperforming class and redistributing the proceeds to the underperforming asset classes – adhering to a contrarian strategy. Consider the table below:
| Asset Class | Strategic Asset Allocation | Beginning of Year Portfolio | Return | Unbalanced Portfolio | Balanced Portfolio |
|---|---|---|---|---|---|
| Stocks | 50% | $5 | 10% | $5.50 | $5.38 |
| Bonds | 50% | $5 | 5% | $5.25 | $5.38 |
As indicated, stocks outperformed bonds, generating a return of 10% compared to 5% for bonds. With the better performance of stocks, the resulting unbalanced portfolio holds $5.50 in stocks and $5.25 in bonds, yielding a strategic asset allocation of 51% in stocks and 49% in bonds. To rebalance the portfolio, the manager must sell the outperforming asset class (stocks) and allocate it into bonds. Thus, an SAA strategy adheres to a contrarian approach to investing. (Source)
Temporary Downturns Will Likely Continue to Wreak Havoc
Since President Trump began the barrage of US tariff policy pronouncements on April 2, 2025, many investors have understandably been on edge. Volatility as measured by the VIX index (see below) has spiked to levels not seen in nearly five years.1 But when there is real economic uncertainty and information is quickly changing, volatility is a sign that markets are functioning.
Sudden drops in the market and heightened volatility can be unnerving, as can rapidly changing economic policies. The market’s job is to process uncertainty in real time. When trade policies change swiftly, markets are incorporating a vast amount of information and expectations about how these shifts may shape the global economy. Markets do this on a forward-looking basis, continuously incorporating new information and setting prices so that expected returns are positive.
| Sidebar: The VIX, formally known as the Chicago Board Options Exchange (CBOE) Volatility Index, measures the anticipated volatility of the S&P 500 index over the next 30 days. Market professionals refer to this as “implied volatility”—implied because the VIX tracks the options market, where traders make predictions about the future performance of various securities and market indices, such as the S&P 500. An increase in the VIX index indicates that professional investors are responding to increased price volatility in the S&P 500 specifically and markets more broadly. A decline in the VIX suggests that investors expect smaller price fluctuations in the S&P 500, implying calmer markets and reduced uncertainty. |
Economic policies, such as those related to international trade, have financial impacts across the economy beyond market returns. The economic implications that markets almost instantaneously price into securities play out over a longer period in the real economy. This difference in velocity is important to underscore, because it points to a difference in how we experience potentially negative (or positive) economic developments as investors versus as participants in the real economy. Even if you are worried about ongoing economic challenges, you should not necessarily expect a negative investment experience going forward, because markets have already factored in known information.
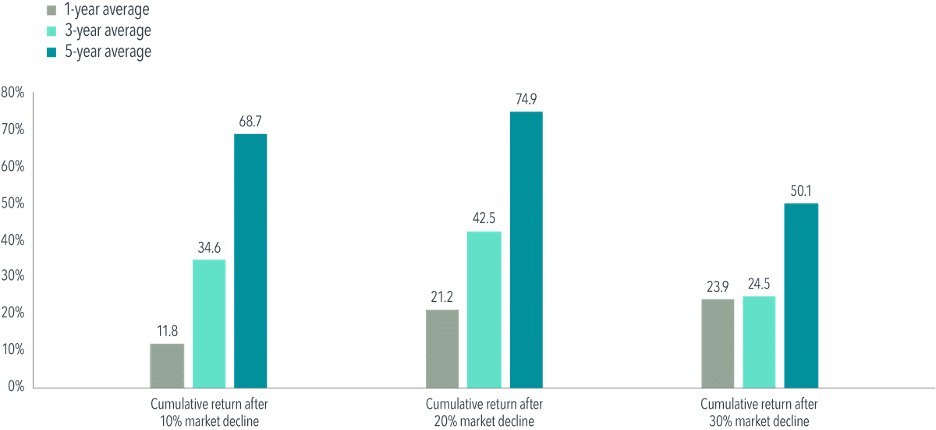
Pain you may feel now reflects markets setting prices such that expected returns are always positive. Exhibit 1 below illustrates that market returns following downturns generally have been positive. When we examine US equity returns following downturns of 10%, 20%, or even 30%, we see one-, three-, and five-year cumulative returns that are positive on average. Viewed in annualized terms across five years, returns after a 20% decline have been close to the US market’s historical average of approximately 10%.2
EXHIBIT 1
Market Gains Can Add Up After Big Declines
Fama/French Total US Market Research Index cumulative returns, July 1, 1926–December 31, 2024
Past performance is no guarantee of future results. Actual returns may be lower. Short-term performance results should be considered in connection with longer-term performance results.
In USD. The Fama/French indices represent academic concepts that may be used in portfolio construction and are not available for direct investment or for use as a benchmark. Index returns are not representative of actual portfolios and do not reflect costs and fees associated with an actual investment. Total returns are calculated for the one-, three-, and five-year periods beginning the day after a downturn of 10%, 20%, or 30% from a new all-time high for the market. The bar chart shows the average total returns for the one-, three-, and five-year periods following the 10%, 20%, and 30% thresholds. For the 10% threshold, there are 30, 29, and 28 observations for the one-, three-, and five-year periods, respectively. For the 20% threshold, there are 16, 15, and 14 observations for the one-, three-, and five-year periods, respectively. For the 30% threshold, there are seven, seven, and six observations for one-, three-, and five-year periods, respectively. Eugene Fama and Ken French are members of the Board of Directors of the general partner of, and provide consulting services to, Dimensional Fund Advisors LP. Fama/French Total US Market Research Index: July 1926–present: Fama/French Total US Market Research Factor + One-Month US Treasury Bills. Source: Ken French website.
Results shown during periods prior to each index’s inception date do not represent actual returns of the respective index. Other periods selected may have different results, including losses. Backtested index performance is hypothetical and is provided for informational purposes only to indicate historical performance had the index been calculated over the relevant time periods. Backtested performance results assume the reinvestment of dividends and capital gains. (Source)
When your portfolio experiences a sudden drop, generally the most important thing an investor can do is to stay invested and look forward to better days ahead. To help soothe the psychological pain, I like to remind clients not to check their investment portfolio balances daily – and to tune out CNBC and other financial news outlets. Remember, the media typically gets higher ratings when there’s negative news. So take a breath, let this current volatility cycle play out, and feel free to give us a call if you would like to discuss further.
Examples of Unexpected Market Moves
As an investor you may recall how in 2022, there was seemingly nowhere to hide. Stocks and bonds got hammered across the board. Bonds, the traditional “shock absorber” to the equity markets, experienced their worst performance in 90 years. However, one sector held its own: oil and gas. You might be wondering how oil stocks soared. It proved the unpredictability of the market and lack of correlation to political events of the day.
Similarly, some market watchers have prognosticated that the current administration looks favorably toward the traditional oil and gas industries, boosting the sectors outlook in 2025. It could work out, but it is too early to tell if any Trump policies will positively impact that sector this year. Time will tell.
It’s a good reminder to think about the law of unintended consequences when applying purely political logic to investment decisions. They do not often go hand in hand. Consequently, it’s too early to get clarity on Trump’s tariffs and the potential impact on world trade, global economies – and your own portfolios. There are simply too many global macro factors at play to make more than an educated guess.
The Importance of a Long-Term Perspective
Amid today’s constant news cycle, investors may get distracted by short-term market fluctuations. Staying focused on long-term goals helps avoid impulsive decisions and emphasizes the fundamentals of investments. By employing a strategic investment approach we aim to build a diversified portfolio tailored to an investor’s needs. By spreading assets across various classes like stocks, bonds, and real estate, investors may reduce risk and enhance potential returns over time.
Remember, AFO is paid to watch the daily gyrations of the markets, mostly taking them in stride in the context of what it important, which is of course helping you to meet or exceed your long term financial objections; we do that so you don’t have to. We help each other stay grounded in real-world observations and solid fundamentals, rather than getting swept up in market mania. By taking a global macro market approach and constantly thinking about long-term investing, we can help navigate volatility with confidence.
Disclosures
Aurelius Family Office, LLC (AFO) is registered as an investment adviser with the SEC and Noticed Filed with the state(s) where it transacts business, unless excluded or exempted from filing requirements. This communication is for information purposes only, and it is not intended to provide specific legal, tax, or other professional advice. Investments involve risk and unless otherwise stated, are not guaranteed. Although information has been obtained from sources deemed to be reliable, we make no guarantee as to the accuracy or completeness of this data. AFO shall not be liable for any errors or omissions, or for any actions taken in reliance thereon. Be sure to first consult with a qualified professional adviser before implementing any strategy discussed herein. Past performance is not indicative of future results.